

Chapter 16
16The Data Science Lifecycle
“AI without data is an engine without fuel; the quality and flow of data determine how far, and how smoothly, it takes you.”
No AI system works without data, and data alone is not enough. The real challenge is managing the whole cycle: from acquiring raw data to deploying a model and improving it continuously. The Data Science Lifecycle (DSLC) is a framework for doing this methodically.
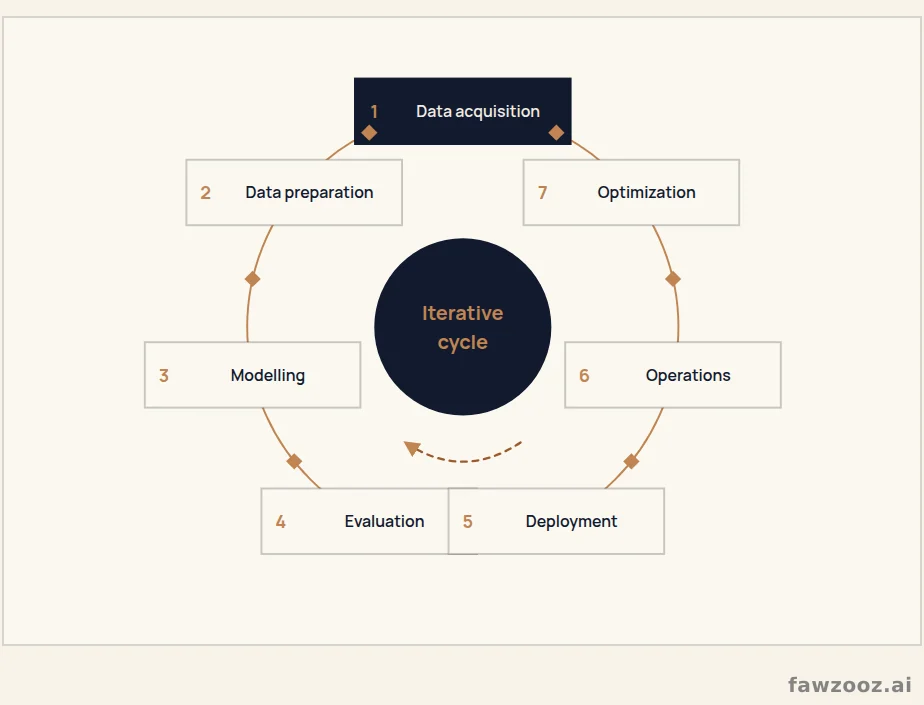
Text in this figure
Iterative · cycle · 1 · Data acquisition · 2 · Data preparation · 3 · Modelling · 4 · Evaluation · 5 · Deployment · 6 · Operations · 7 · Optimization · Figure 21
Stage 1: Data Acquisition
“Collect data before you need it,” a saying in data science.
- Internal systems: CRM databases, ERP records and user-generated content.
- External sources: public datasets and API feeds: social media, weather and economic indicators.
- Sensors and IoT: real-time streams of data, alarms and status from machines, vehicles and smart devices.
- Quality and relevance: validity: accurate, consistent and uncorrupted? Coverage: does it represent all scenarios? Ethics: does it respect privacy (GDPR, CCPA)?
- Outcomes: a securely stored raw dataset, and early insight into biases, missing values and red flags.
Stage 2: Data Preparation
“80% of a data scientist’s work is cleaning data, and the rest is complaining about cleaning it,” a popular joke.
- Cleaning: handling missing values by imputation, deletion or modelling, removing duplicates, and deciding whether outliers are valid or anomalous.
- Feature engineering: transformation, such as extracting the week number from a timestamp; encoding, such as turning “city name” into numbers; and dimensionality reduction with PCA or autoencoders.
- Splitting: training, validation and test sets: validation to tune hyperparameters, testing to measure final performance.
- Outcomes: clean, structured data with defined features, and clear splits.
Stage 3: Modelling
“All models are wrong, but some are useful,” George Box.
- Choosing the algorithm: by problem type (classification, regression or clustering) and data characteristics: classic, such as decision trees, random forests and XGBoost; deep, such as convolutional and recurrent networks and transformers; or reinforcement, such as Q-learning and policy gradients.
- Hyperparameter tuning: grid and random search, and the more efficient Bayesian optimization.
- Training: GPUs when needed, and the time-versus-accuracy trade-off.
- Outcomes: a trained model with hyperparameters that perform well.
Stage 4: Evaluation
“Validation data is your friend; it keeps you honest.”
- Metrics: classification: Accuracy, Precision, Recall, F1 and ROC-AUC. Regression: RMSE, MAE and R². Clustering: silhouette score and Davies–Bouldin index. Business: churn rate, conversion lift and savings.
- Validation: hold-out split, K-fold cross-validation, and real-world testing through pilots or “shadow mode.”
- Bias and fairness: demographic parity, and explainability with tools such as SHAP and LIME.
- Outcomes: a clear technical and business picture, and ethical issues identified before deployment.
Stage 5: Deployment
“A model that never reaches production is an expensive research project.”
- Deployment strategies: periodic batch processing, real-time inference through APIs and microservices, and edge deployment for instant results.
- MLOps practices: continuous integration and delivery (CI/CD), model version control, and monitoring and logging of performance, drift and system usage.
- Outcomes: a live system interacting with users, plus documentation and versions that simplify updates.
Stage 6: Operations
“Putting the model into production is the beginning, not the end.”
- Health monitoring: data drift when inputs change, model drift when the world departs from the training environment, and alerting when thresholds are crossed.
- Feedback loop: user feedback reveals where it excels and fails, and triggers retraining when performance degrades or new data arrives.
- Outcomes: continuous maintenance with an established mechanism, and understanding of the model’s real-world behavior.
Stage 7: Optimization
“Today’s best model may be outdated tomorrow.”
- Continuous improvement: integrating fresh data, new tuning cycles, and exploring stronger techniques such as moving to deep learning or to an ensemble.
- Efficiency gains: pruning and compressing models for faster, cheaper, lower-energy inference, and distributed computing at peak demand.
- Business alignment: re-aligning metrics with evolving goals, and involving sales, marketing and operations.
Why the Cycle Is Iterative
The cycle is not linear; each stage refines the others. Evaluation may reveal a data-quality problem, sending us back to preparation. Continuous iteration keeps systems flexible and current.
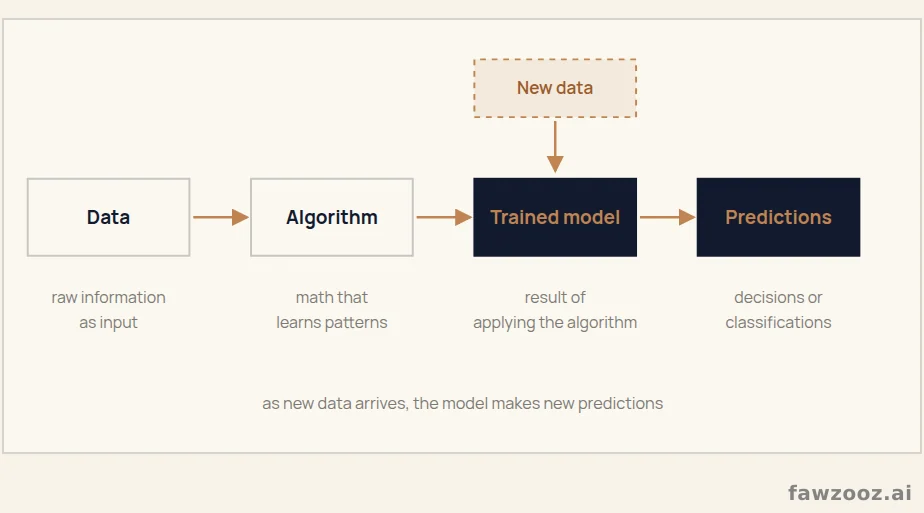
Text in this figure
Data · raw information · as input · Algorithm · math that · learns patterns · Trained model · result of · applying the algorithm · Predictions · decisions or · classifications · New data · as new data arrives, the model makes new predictions · Figure 22
The Lifecycle in the Foundation-Model Era
2026 Update
When we build on a foundation model, the cycle’s features change while its logic stays the same, sometimes called LLMOps: “data” becomes the knowledge base and example sets; “modelling” becomes choosing the model and designing prompts, retrieval and fine-tuning; “evaluation” becomes answer test sets and checks for hallucination and safety; and “operations” adds monitoring of token cost, latency and prompt-injection attempts, with prompts versioned the way code is.
Not every participant needs to be an expert in these technical details, but a general understanding of them is essential for everyone involved.
Lessons Learned
- 1The cycle provides methodical structure: acquire, prepare, model, evaluate, deploy, operate, optimize.
- 2Data quality is king, and sound governance is its foundation.
- 3Continuous evaluation and monitoring keep models accurate and fair.
- 4Deployment is not the end; drift requires retraining.
- 5Collaboration among scientists, engineers, product owners and executives is essential.
Tip: use ← → to move between sections.