

Chapter 18
18Integrating Business, Math, Data and Technology
“AI breakthroughs happen at the intersection of domain knowledge, data strategy, mathematical insight and technical execution.”
How do we align AI efforts with core business goals while reconciling the complexities of math, data and technology? This chapter is about the cross-functional alignment that makes an initiative technically successful and organizationally impactful.
Why Interdisciplinary Collaboration Is Vital
- Holistic problem-solving: technical teams alone may build advanced models with no value, and business teams alone may underestimate data complexity; collaboration aligns the solution with need and feasibility.
- Risk mitigation: a good team catches flawed assumptions and misaligned goals early.
- Efficiency and momentum: siloed teams duplicate work and clash over priorities; unified effort keeps the project on track and on budget.
Translating Business Questions into AI Problems
- Define the challenge: a measurable outcome, such as cutting churn 15% or raising average order value 10%, with KPIs set in advance such as Net Promoter Score (NPS).
- Data readiness: availability, quality, and ethical and regulatory constraints.
- Frame the problem: classification: who will churn? Regression: how much demand? Recommendation: what do we suggest? Clustering: how do we segment customers? Or generation: what do we write or design?
The Four Pillars of Success
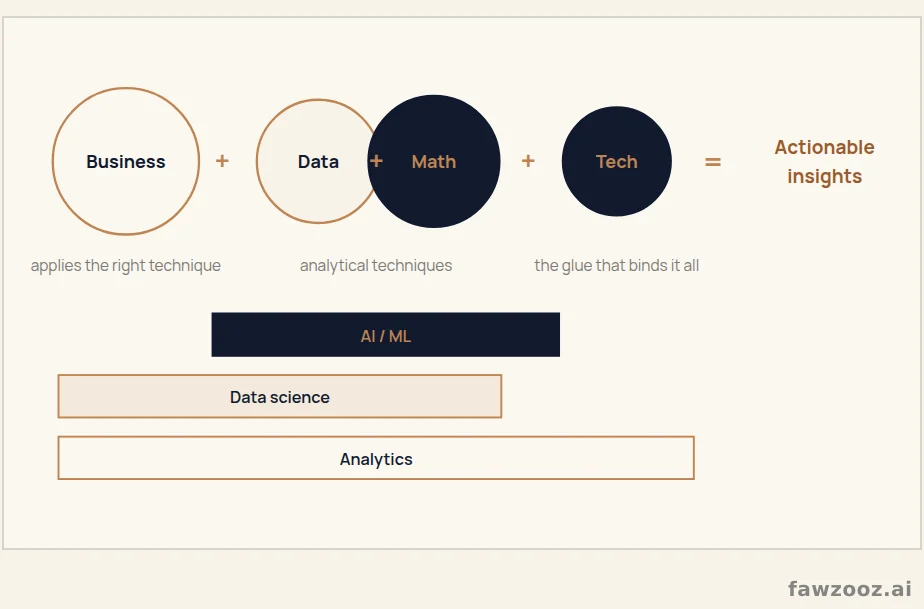
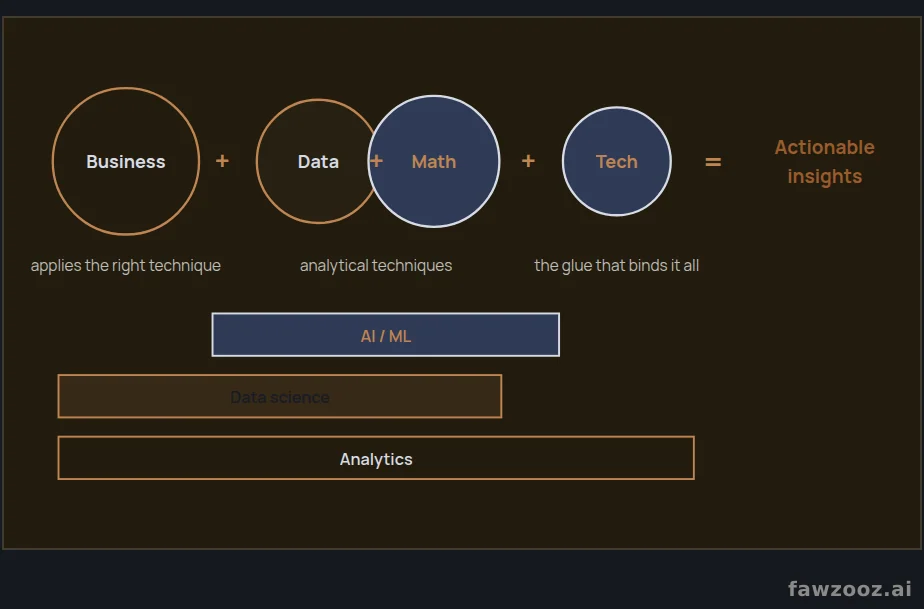
Analytics, data science and AI overlap: analytics describes data, data science builds models and predictions, and AI adds self-learning and decision-making. The following figure shows four circles, business, data, math and technology, interacting to produce actionable insights.
Text in this figure
Business · + · Data · + · Math · + · Tech · = · Actionable · insights · applies the right technique · analytical techniques · the glue that binds it all · AI / ML · Data science · Analytics · Figure 24 · * This figure was developed from concepts presented in the Post Graduate Program in AI for Leaders (UT Austin McCombs / Great Learning).
- Business: defines the vision and success and measures return, owns knowledge of the market, competitors and users, and works with translators and scientists to refine the problem.
- Math (analytics and modelling): analytical depth: choosing algorithms, interpreting results and ensuring statistical validity, turning data into predictive and prescriptive insight.
- Data: pipelines, architecture and governance; without them performance suffers and bias appears.
- Technology (engineering and operations): infrastructure that supports deployment, scale and real-time operation, and systems that deliver insights through apps, dashboards and APIs; it is the “glue” that binds it all.
Strategies to Strengthen Collaboration
- Small agile teams: at least one member from each pillar, a shared goal (say, improving recommendation quality by 20%), and short daily or weekly check-ins.
- Shared language and documentation: a glossary combining business terms (LTV, ROI) and technical ones (RMSE, precision, recall), and model cards and datasheets that record assumptions and limits.
- Governance frameworks: steering committees that reprioritize, and project charters with scope, milestones and responsibilities signed by everyone.
Overcoming Collaboration Challenges
- Misaligned incentives: data wants perfection and business wants speed; the solution is metrics balancing speed, quality and return.
- Communication gaps: the scientist speaks F1 and AUC, the leader speaks revenue; the solution is data translators and “demo days” in plain language.
- Resource constraints: overstretched engineering defers AI pipelines; the solution is dedicated budgets and tracked return.
- Siloed data: separate databases and conflicting definitions; the solution is unified governance, standard definitions and a central or federated architecture.
Example: AI-Powered Demand Forecasting
| Pillar | What it did |
|---|---|
| The challenge | a retailer wants to forecast monthly sales to optimize inventory |
| Business | goal: cut stock-outs by 30%, with a budget for data-engineering improvements |
| Data | sales history, seasonality, promotion calendar, weather and economic data from multiple stores |
| Math | time series: ARIMA, Prophet or an LSTM network, tuned to business cycles |
| Technology | pipelines ingest point-of-sale data daily, MLOps retrains monthly, and a forecasting API triggers purchase orders automatically |
| The result | fewer shortages and less overstock, higher revenue and a better customer experience |
Lessons Learned
- 1Cross-functional alignment is essential: strategy, mathematical rigor, data integrity and technical robustness.
- 2Start from return and goal, then define data and model requirements.
- 3Four pillars, each with a unique lens.
- 4Agile teams, shared glossaries, steering committees and strong documentation.
- 5When everyone works to the same metrics, AI becomes a lever for growth.
Tip: use ← → to move between sections.